Overview of Schelling’s Model
The Nobel prize winning economist Thomas Schelling developed a model that shows how global patterns of spatial segregation can arise from the effect of homophily operating at a local level. Homophily is the principle that we tend to be similar to our friends and/or neighbors.
T. Schelling. Dynamic models of segregation. The Journal of Mathematical Sociology, 1(2), 143-186, 1971.
See also,
J. M. Sakoda, The checkerboard model of social interaction. The Journalof Mathematical Sociology 1(1), 119-132, 1971.
R. Hegselmann, Thomas C. Schelling and James M. Sakoda: The intellectual, technical, and social history of a model. Journal of Artificial Societies and Social Simulation 20 (3), 2017.
There are two components of the Schelling model:
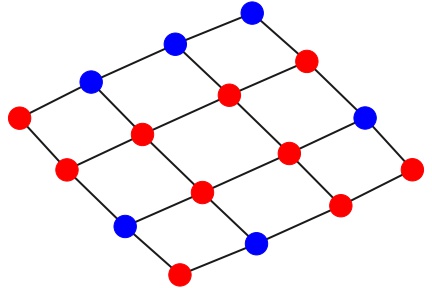
A grid representing different locations for the agents
A set of agents with two properties:
The agent type (e.g., ‘red’ or ‘blue’)
The current position of the agent in the grid
An example of a grid with two types of agents:
At each round of the simulation:
For each agent \(a\), determine the number of neighbors that are of the same type.
Agent \(a\) is happy if the number of similar agents is above a fixed threshold.
If \(a\) is not happy, then \(a\) moves to an empty location.
Continue that process for a fixed number of rounds or until every agent is happy.
Implementing Schelling’s Model using Mesa
from mesa import Model, Agent
from mesa.time import RandomActivation
from mesa.space import SingleGrid
from mesa.datacollection import DataCollector
class SchellingAgent(Agent):
    '''
    Schelling segregation agent
    '''
    def __init__(self, unique_id, pos, model, agent_type):
        '''
         Create a new Schelling agent.
         Args:
            pos: Agent initial location.
            agent_type: Indicator for the agent's type (minority=1, majority=0)
        '''
        super().__init__(unique_id, model)
        self.pos = pos
        self.type = agent_type

    def step(self):
        similar = 0
        neighbors = self.model.grid.neighbor_iter(self.pos)
        for neighbor in neighbors:
            if neighbor.type == self.type:
                similar += 1

        # If unhappy, move:
        if similar < self.model.homophily:
            self.model.grid.move_to_empty(self)
        else:
            self.model.happy += 1
class SchellingModel(Model):
    '''
    Model class for the Schelling segregation model.
    '''
    def __init__(self, height, width, density, minority_percent, homophily, seed = None):

        self.height = height
        self.width = width
        self.density = density
        self.minority_percent = minority_percent
        self.homophily = homophily

        self.schedule = RandomActivation(self)
        self.grid = SingleGrid(height, width, torus=True)

        self.happy = 0
        self.datacollector = DataCollector(
            {"happy": lambda m: m.happy},  # Model-level count of happy agents
            # For testing purposes, agent's individual x and y
            {"x": lambda a: a.pos[0], "y": lambda a: a.pos[1]})
        self.running = True
        # Set up agents
        agent_id = 0
        for cell in self.grid.coord_iter():
            #print(cell)
            _,x,y = cell
            if self.random.random() < self.density:
                if self.random.random() < self.minority_percent:
                    agent_type = 1
                else:
                    agent_type = 0
                agent = SchellingAgent(agent_id, (x, y), self, agent_type)
                agent_id += 1
                self.grid.position_agent(agent, x=x, y=y)
                self.schedule.add(agent)

    def step(self):
        '''
        Run one step of the model. If All agents are happy, halt the model.
        '''
        self.happy = 0  # Reset counter of happy agents
        self.schedule.step()
        self.datacollector.collect(self)
        if self.happy == self.schedule.get_agent_count():
            self.running = False
Create a model instance: a 10x10 grid, a 10% chance of an agent being placed in each cell, approximately 20% of agents set as minorities, and each agent wants at least 3 similar neighbors.
height, width = 10, 10
density = 0.1
minority_percent = 0.2
homophily = 4
model = SchellingModel(height, width, density, minority_percent, homophily)
print("Display the first 5 agents:\n")
for a in model.schedule.agents[0:5]:
    print(a)
    print("type is ", a.type)
    print(f"pos is {a.pos}")
    print(f"unique id is {a.unique_id}\n")
Display the first 5 agents:

<__main__.SchellingAgent object at 0x151fbf4c0>
type is  0
pos is (1, 6)
unique id is 0

<__main__.SchellingAgent object at 0x151fbf460>
type is  0
pos is (5, 0)
unique id is 1

<__main__.SchellingAgent object at 0x151fbf550>
type is  0
pos is (8, 3)
unique id is 2

<__main__.SchellingAgent object at 0x151fbf100>
type is  1
pos is (9, 8)
unique id is 3
# execute one round of the models
model.step()

# some positions should change
for a in model.schedule.agents[0:5]:
    print(a)
    print("type is ", a.type)
    print(f"pos is {a.pos}")
    print(f"unique id is {a.unique_id}")
    print(f"model.happy = {model.happy}\n")
<__main__.SchellingAgent object at 0x151fbf4c0>
type is  0
pos is (1, 7)
unique id is 0
model.happy = 0

<__main__.SchellingAgent object at 0x151fbf460>
type is  0
pos is (1, 9)
unique id is 1
model.happy = 0

<__main__.SchellingAgent object at 0x151fbf550>
type is  0
pos is (5, 1)
unique id is 2
model.happy = 0

<__main__.SchellingAgent object at 0x151fbf100>
type is  1
pos is (1, 4)
unique id is 3
model.happy = 0
Note that on line 17 of the definition of SchellingModel we have the following code:
self.schedule = RandomActivation(self)
This activates the agents one at a time in random order with the order reshuffled every step of the model.
See the source code for details.
# To illustrate the RandomAcitivation scheduler, note that running this
# multiple times will produce different orders of the agents

print([a.unique_id for a in model.schedule.agent_buffer(shuffled=True)])
[3, 1, 2, 0]
Note that line 18 of the definition of the SchellingModel has the following code:
self.grid = SingleGrid(height, width, torus=True)
This defines a grid to place the agents.
See the course code for details.
# create a simple Schelling model with a 3x3 grid
model2 = SchellingModel(3, 3, 0, 0.2, 4)

# each cell is a tuple where the first component is the agent,
# the second component is the x position and
# the 3rd component is the y position
for cell in model2.grid.coord_iter():
    print(cell)
(None, 0, 0)
(None, 0, 1)
(None, 0, 2)
(None, 1, 0)
(None, 1, 1)
(None, 1, 2)
(None, 2, 0)
(None, 2, 1)
(None, 2, 2)
a1 = SchellingAgent(0, (1, 1), model2, 0)

# initially position the agent at 1,1
model2.grid.position_agent(a1, x=1, y=1)

for cell in model2.grid.coord_iter():
    print(cell)
print(f"\na1 pos is {a1.pos}")
(None, 0, 0)
(None, 0, 1)
(None, 0, 2)
(None, 1, 0)
(<__main__.SchellingAgent object at 0x151fc77c0>, 1, 1)
(None, 1, 2)
(None, 2, 0)
(None, 2, 1)
(None, 2, 2)

a1 pos is (1, 1)
# now move a1 to an empty location
model2.grid.move_to_empty(a1)

for cell in model2.grid.coord_iter():
    print(cell)
print(f"\na1 pos is {a1.pos}")
(<__main__.SchellingAgent object at 0x151fc77c0>, 0, 0)
(None, 0, 1)
(None, 0, 2)
(None, 1, 0)
(None, 1, 1)
(None, 1, 2)
(None, 2, 0)
(None, 2, 1)
(None, 2, 2)

a1 pos is (0, 0)
model2 = SchellingModel(3, 3, 0, 0.2, 4)
model2.grid = SingleGrid(3, 3, torus=True)

a1 = SchellingAgent(1, (1, 1), model2, 0)
a2 = SchellingAgent(2, (1, 0), model2, 0)
a3 = SchellingAgent(3, (0, 0), model2, 0)
a4 = SchellingAgent(4, (2, 2), model2, 0)

model2.grid.position_agent(a1, x=1, y=1)
model2.grid.position_agent(a2, x=1, y=0)
model2.grid.position_agent(a3, x=0, y=0)
model2.grid.position_agent(a4, x=2, y=2)

print("The neighbors of a1 are: ")
for n in model2.grid.neighbor_iter(a1.pos):
    print(f"a{n.unique_id} at {n.pos}")

print("The neighbors of a3 are: ")
for n in model2.grid.neighbor_iter(a3.pos):
    print(f"a{n.unique_id} at {n.pos}")
The neighbors of a1 are:
a3 at (0, 0)
a2 at (1, 0)
a4 at (2, 2)
The neighbors of a3 are:
a4 at (2, 2)
a2 at (1, 0)
a1 at (1, 1)
Instatiate a model instance: a 10x10 grid, with an 80% chance of an agent being placed in each cell, approximately 20% of agents set as minorities, and agents wanting at least 3 similar neighbors. Run the model at most 100 times.
height, width = 50, 50
density = 0.8
minority_percent = 0.3
homophily = 4
model = SchellingModel(height, width, density, minority_percent, homophily)

while model.running and model.schedule.steps < 1000:
    model.step()
print(f"The model ran for {model.schedule.steps} steps") # Show how many steps have actually run
The model ran for 1000 steps
Lines 21 - 24 of the definition of the SchellingModel has the following code:
self.datacollector = DataCollector(
{"happy": lambda m: m.happy},  # Model-level count of happy agents
# For testing purposes, agent's individual x and y
{"x": lambda a: a.pos[0], "y": lambda a: a.pos[1]})
This code is called in the step() method on line 47:
self.datacollector.collect(self)
The DataCollector is a simple, standard way to collect data generated by a Mesa model. It collects three types of data: model-level data, agent-level data, and tables.
See the documentation for details.
Use the method get_model_vars_dataframe to get the model-level data after running the model.
Use the method get_agent_vars_dataframe to get the agent-level data after running the model.
Both returna a Pandas dataframe. Pandas is a popular tool for data analysis and manipulation.
import pandas as pd

data = {
    "var1": [1, 2, 3, 4, 5],
    "var2": ["a", "b", "c", "d", "e"],
    "var3": [1, None, "a", 2.0, "c"]
}

df = pd.DataFrame(data)

df
| var1 | var2 | var3 | |
|---|---|---|---|
| 0 | 1 | a | 1 |
| 1 | 2 | b | None |
| 2 | 3 | c | a |
| 3 | 4 | d | 2.0 |
| 4 | 5 | e | c |
We will discuss Pandas in more detail later in the text. For now, see the 10-minute introduction to Pandas.
model_out = model.datacollector.get_model_vars_dataframe()
model_out
| happy | |
|---|---|
| 0 | 1194 |
| 1 | 1459 |
| 2 | 1593 |
| 3 | 1685 |
| 4 | 1725 |
| ... | ... |
| 995 | 1993 |
| 996 | 1993 |
| 997 | 1993 |
| 998 | 1993 |
| 999 | 1993 |
1000 rows × 1 columns
# use describe() to get basic statistics about the data
model_out.describe()
| happy | |
|---|---|
| count | 1000.000000 |
| mean | 1979.783000 |
| std | 39.494122 |
| min | 1194.000000 |
| 25% | 1984.000000 |
| 50% | 1987.000000 |
| 75% | 1991.000000 |
| max | 1994.000000 |
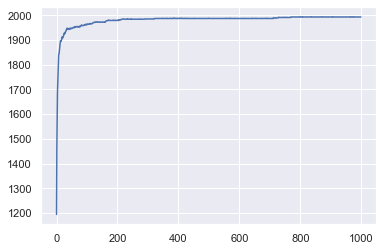
import seaborn as sns
sns.set()

model_out.happy.plot();
agent_out = model.datacollector.get_agent_vars_dataframe()
agent_out.head()
| x | y | ||
|---|---|---|---|
| Step | AgentID | ||
| 1 | 0 | 0 | 0 |
| 1 | 0 | 1 | |
| 2 | 0 | 2 | |
| 3 | 0 | 3 | |
| 4 | 0 | 4 |
Exploring the Parameter Space
from mesa.batchrunner import BatchRunner

def get_segregation(model):
    '''
    Find the % of agents that only have neighbors of their same type.
    '''
    segregated_agents = 0
    for agent in model.schedule.agents:
        segregated = True
        for neighbor in model.grid.neighbor_iter(agent.pos):
            if neighbor.type != agent.type:
                segregated = False
                break
        if segregated:
            segregated_agents += 1
    return segregated_agents / model.schedule.get_agent_count()
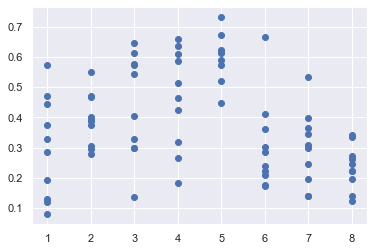
variable_params = {"homophily": range(1,9)}
fixed_params =  {"height": 10, "width": 10, "density": 0.8, "minority_percent": 0.2}
model_reporters = {"Segregated_Agents": get_segregation}
param_sweep = BatchRunner(SchellingModel,
                          variable_params,
                          fixed_params,
                          iterations=10,
                          max_steps=200,
                          model_reporters=model_reporters,
                          display_progress=False)
param_sweep.run_all()
df = param_sweep.get_model_vars_dataframe()
df
| homophily | Run | Segregated_Agents | height | width | density | minority_percent | |
|---|---|---|---|---|---|---|---|
| 0 | 1 | 0 | 0.118421 | 10 | 10 | 0.8 | 0.2 |
| 1 | 1 | 1 | 0.470588 | 10 | 10 | 0.8 | 0.2 |
| 2 | 1 | 2 | 0.192308 | 10 | 10 | 0.8 | 0.2 |
| 3 | 1 | 3 | 0.373494 | 10 | 10 | 0.8 | 0.2 |
| 4 | 1 | 4 | 0.443038 | 10 | 10 | 0.8 | 0.2 |
| ... | ... | ... | ... | ... | ... | ... | ... |
| 75 | 8 | 75 | 0.220779 | 10 | 10 | 0.8 | 0.2 |
| 76 | 8 | 76 | 0.123457 | 10 | 10 | 0.8 | 0.2 |
| 77 | 8 | 77 | 0.263158 | 10 | 10 | 0.8 | 0.2 |
| 78 | 8 | 78 | 0.340909 | 10 | 10 | 0.8 | 0.2 |
| 79 | 8 | 79 | 0.243902 | 10 | 10 | 0.8 | 0.2 |
80 rows × 7 columns
import matplotlib.pyplot as plt

plt.scatter(df.homophily, df.Segregated_Agents)
plt.grid(True)
Additional Reading
Brian Hayes, The Math of Segregation, American Scientist.
Christina Brandt, Nicole Immorlica, Gautam Kamath, and Robert Kleinberg, An Analysis of One-Dimensional Schelling Segregation, Proceedings of the forty-fourth annual ACM symposium on theory of computing, 2012.
Matthew Jackson, Chapter 5, The Human Network: How Your Social Position Determines Your Power, Beliefs, and Behaviors, Vintage, 2020.
David Easley and Jon Kleinberg, Section 4.5, Networks, Crowds, and Markets: Reasoning about a Highly Connected World, Cambridge University Press, 2010