Epistemic Networks
What is the best form for social influence to take? Is it better to have more rather than less social influence? Are all policies which aim to increase the amount of interaction over a particular issue likely to be successful in their aims?
To answer these questions, we look at the agent-based model from:
K. Zollman (2007). The Communication Structure of Epistemic Communities, Philosophy of Science, 74:5, pp. 574 - 587.
The above paper builds on ideas from the following two classic papers:
V. Bala and S. Goyal (1998). Learning from neighbors, Review of Economic Studies, 65 (3), 595 - 621.
B. Golub and M. O. Jackson (2010). Naive learning in social networks and the wisdom of crowds, American Economic Journal: Microeconomics, pages 112 - 149.
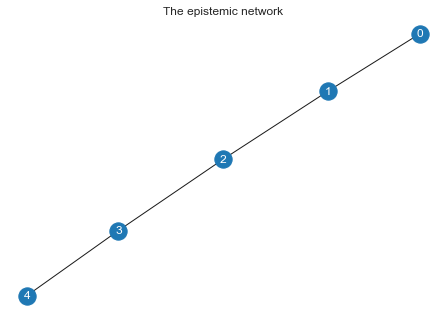
The agents are situated in a network and must decide between two actions: action \(A\) and action \(B\). It is known by all agents that action \(A\) is successful with probability 0.5. The success rate of action \(B\) is unknown. It is either slightly better with a success rate of \(0.5 + \epsilon\) or slightly worse with a success rate of \(0.5 - \epsilon\).
It is assumed that action \(B\) has a success rate of \(0.5 + \epsilon\), so it is preferable to action \(A\) (it is the “true act”).
The goal is for agents to determine which of the actions has a higher success rate (i.e., to find out that action \(B\) is preferable to aciton \(A\)).
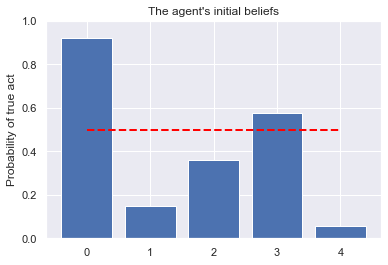
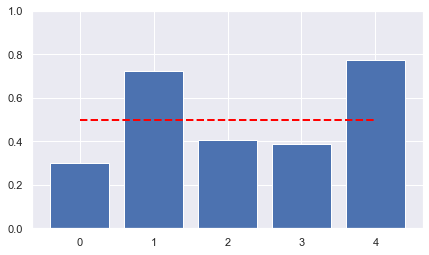
Each agent has a probability about the success rate of act \(B\). Initially, these beliefs are assigned at random.
In each round of simulation:
The agents choose the action that they believe has the highest success rate: If their belief is \(< 0.5\) that action \(B\) has a success rate of \(0.5 + \epsilon\), then they choose to perform action \(A\), otherwise they choose to perform action \(B\) (with a success rate of \(0.5 + \epsilon\)).
The agents experiment with their chosen action. However, since there is no uncertainty regarding action \(A\) (it is known that the success rate is \(0.5\)), if action \(A\) is chosen, then no experiment is performed.
Each agent observes the outcome of his action and the outcome of the agents that they are connected to in the network. Given this evidence, the agents update their beliefs about the success rate of action \(B\).
import numpy as np
import random
import math
from scipy.stats import beta
import networkx as nx
import pandas as pd
from matplotlib import animation
from IPython.display import HTML, display

from mesa import Model, Agent
from mesa.space import NetworkGrid
from mesa.time import RandomActivation

import matplotlib.pyplot as plt
import matplotlib
import seaborn as sns

import mpmath
from mpmath import mp
mp.prec = 100
sns.set()
from tqdm.notebook import tqdm
from itertools import starmap
The implementation of the actions is essentially the same as the implementation of the Coin with different biases from the overview.
class SimpleAction(object):

    def __init__(self, prob_success):

        assert prob_success >= 0 and prob_success <= 1, f"{prob_success} must be between 0 and 1"
        self.prob_success = prob_success

    def execute(self, num = 1):

        return np.random.binomial(num, self.prob_success)

    def pr(self, num_success, total):

        assert num_success <= total, f"the successes {num_success} cannot be greater than the total {total}"
        return mp.mpf(self.prob_success)**mp.mpf(num_success) * mp.mpf((1 - self.prob_success))**mp.mpf((total - num_success))

    def __str__(self):
        return f"P(s)={self.prob_success}"
class Learner(Agent):

    def __init__(self, unique_id, model, known_mean, acts, pos, default_num_trials = 1000):
        super().__init__(unique_id, model)
        self.known_mean = known_mean
        self.default_num_trials = default_num_trials
        self.acts = acts

        self.num_success = 0 # number of successes of the current experiment
        self.num_trials = 0 # number of times the current experiment was performed
        if len(acts) == 2:
            prior = generate_prior_two_acts()
            self.pr = {acts[0]: prior[0], acts[1]: prior[1]}
        else:
            prior = generate_prior(len(acts))
            self.pr = {a: prior[a_idx] for a_idx,a in enumerate(acts)}
        self.pos = pos

    def belief(self, act):
        return self.pr[act]

    def update_bayes(self, num_success, num_trials):
        '''update using Bayes Theorem'''
        new_bel = dict()
        for act in self.pr.keys():
            new_bel[act] = act.pr(num_success, num_trials) * self.pr[act] / sum((self.pr[_a] * _a.pr(num_success, num_trials) for _a in self.acts))
        self.pr = new_bel

    def choice(self):
        act = max(self.pr.items(), key = lambda p: p[1])[0]
        if act.prob_success > self.known_mean:
            return act
        else:
            return None

    def experiment(self, num_trials = None):

        act = self.choice()

        if act is not None:
            num_trials = num_trials if num_trials is not None else self.default_num_trials
            self.num_success = act.execute(num=num_trials)
            self.num_trials = num_trials
        else:
            self.num_success = 0
            self.num_trials = 0

class BGModel(Model):

    def __init__(self, network, acts, true_act, known_mean,
                 default_num_trials = 1000):

        self.acts = acts
        self.true_act = true_act
        self.known_mean = known_mean
        self.schedule = RandomActivation(self)
        self.network = NetworkGrid(network)
        self.running = True

        # Set up the agents
        agent_id = 0
        for n in network.nodes:
            agent = Learner(agent_id,
                            self,
                            self.known_mean,
                            self.acts,
                            n, # position in network
                            default_num_trials = default_num_trials)
            self.network.place_agent(agent, n)
            self.schedule.add(agent)
            agent_id += 1

    def converged(self):

        if all([a.belief(self.true_act) > mp.mpf(0.99) for a in self.schedule.agents]):
            return 1 # beliefs converged on the true act
        elif all([a.choice() is None for a in self.schedule.agents]):
            return 0 # no longer experimenting
        else:
            return -1 # undecided

    def step(self, num_tests = None):

        # all the agents perform their experiments
        for a in self.schedule.agents:
            a.experiment(num_tests)

        for a in self.schedule.agents:

            total_success = 0
            total_trials = 0
            # neighbors include a
            neighbors_nodes = [n_pos for n_pos in self.network.get_neighbors(a.pos, include_center = True)]
            neighbors = [n for n in self.schedule.agents if n.pos in neighbors_nodes]
            for n in neighbors:
                total_success += n.num_success
                total_trials += n.num_trials
            a.update_bayes(total_success, total_trials)

        if self.converged() in [0,1]:
            self.running = False
Note
The model assumes that the agent is uncertain about two possible acts: Act \(B\) either has a success rate of \(0.5 + \epsilon\) or it has a success rate of \(0.5 -\epsilon\). Note that the above implementation allows agents to be uncertain about any number of acts.
The agent’s initial beliefs are assigned at random. It is convenient to create a function to generate the prior beliefs.
def generate_prior_two_acts():
    pr1 = np.random.uniform(0,1)
    return pr1, 1-pr1
known_mean = 0.5
num_trials = 100 # the number of trials performed by the agents at each round
num_experts = 5 # number of experts
G = nx.path_graph(num_experts) # the epsitemic network
epsilon = 0.01
true_act = SimpleAction(known_mean + epsilon)
acts = [true_act, SimpleAction(known_mean - epsilon)]
max_num_experiments = 1000
convergence_types = {
1: "Successful",
0: "Unsuccessful",
-1: "Undecided"
}
nx.draw(G, with_labels=True, font_color='white')
plt.title("The epistemic network")
plt.show()
plt.cla()
model = BGModel(G, acts, true_act, known_mean, default_num_trials = num_trials)
plt.bar([str(a.unique_id) for a in model.schedule.agents],
[a.belief(true_act) for a in model.schedule.agents])
plt.plot([str(a.unique_id) for a in model.schedule.agents],
[known_mean]*len(model.schedule.agents),
'--', color='red',lw=2)
plt.title("The agent's initial beliefs")
plt.ylim(0,1)
plt.ylabel("Probability of true act")
plt.show()
plt.cla()
num_experiments = 0
while model.running and num_experiments < max_num_experiments:
model.step()
num_experiments += 1
print(f"After {num_experiments} experiment(s), the convergence type is {convergence_types[model.converged()]}")
print()
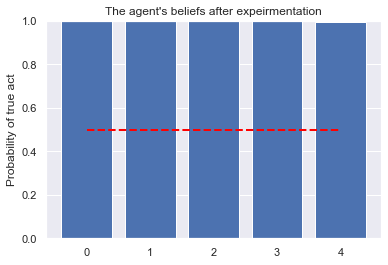
plt.bar([str(a.unique_id) for a in model.schedule.agents],
[a.belief(true_act) for a in model.schedule.agents])
plt.plot([str(a.unique_id) for a in model.schedule.agents],
[known_mean]*len(model.schedule.agents),
'--', color='red', lw=2)
plt.title("The agent's beliefs after expeirmentation")
plt.ylim(0,1)
plt.ylabel("Probability of true act")
plt.ylim(0,1)
plt.show()
After 156 experiment(s), the convergence type is Successful
known_mean = 0.5
epsilon = 0.001
true_act = SimpleAction(known_mean + epsilon)
acts = [true_act, SimpleAction(known_mean - epsilon)]
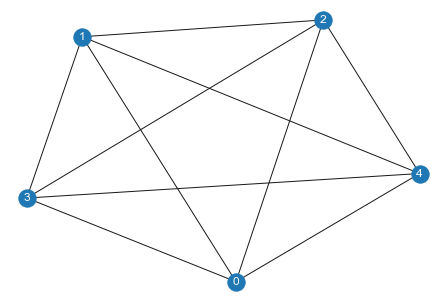
num_agents = 5
G=nx.complete_graph(num_agents)
default_num_trials = 100
nx.draw(G, with_labels=True, font_color='white')
plt.show();
plt.clf()
fig, ax = plt.subplots(figsize=(7,4));
m = 2
model = BGModel(G, acts, true_act, known_mean, default_num_trials = default_num_trials)
ax.bar([str(a.unique_id) for a in model.schedule.agents],
[a.belief(true_act) for a in model.schedule.agents])
ax.plot([str(a.unique_id) for a in model.schedule.agents],
[known_mean]*len(model.schedule.agents),
'--', color='red',lw=2)
ax.set_ylim(0,1)
plt.show();
def draw_barchart(num):
model.step()
ax.clear()
ax.bar([str(a.unique_id) for a in model.schedule.agents],
[a.belief(true_act) for a in model.schedule.agents])
ax.plot([str(a.unique_id) for a in model.schedule.agents],
[known_mean]*len(model.schedule.agents), '--', color='red',lw=2)
ax.set_ylim(0,1)
animator = animation.FuncAnimation(fig, draw_barchart, frames=range(1, 100), interval=1)
HTML(animator.to_jshtml())
<Figure size 432x288 with 0 Axes>
Caution
Exploring the parameter space for the above simulation takes a very long time. To see the code used the generate the following graphs, see the code below the fold. Note that the code uses multiprocessing.
from multiprocess import Pool, cpu_count

def run_simulation(network, m, acts, true_act, known_mean, max_num_experiments):

    data = {
        "successful_convergence": 0,
        "time_to_convergence": 0,
        "unsuccessful_convergence": 0,
    }

    model = BGModel(network, m, acts, true_act, known_mean)
    num_experiments = 0
    while model.running and num_experiments < max_num_experiments:
        model.step()
        num_experiments += 1

    convergence_type = model.converged()

    if convergence_type == 1:
        data["successful_convergence"] = 1
        data["time_to_convergence"] = num_experiments
    elif convergence_type == 0:
        data["unsuccessful_convergence"] = 1
        data["time_to_convergence"] = num_experiments
    return data
SKIP_SIMULATION = True # skip running this by default, since it takes a very long time to run

if not SKIP_SIMULATION:
    all_prob_data = {
        "num_agents": list(),
        "graph": list(),
        "difficulty": list(),
        "prob_successful_convergence": list(),
        "prob_unsuccessful_convergence": list(),
        "avg_time_to_convergence": list(),
    }

    all_data = {
        "num_agents": list(),
        "graph": list(),
        "difficulty": list(),
        "successful_convergence": list(),
        "unsuccessful_convergence": list(),
        "time_to_convergence": list(),
    }

    all_num_agents = [3, 4, 5, 6, 7, 8, 9, 10, 11, 15, 20]

    graphs = {
        "path": {n: nx.path_graph(n) for n in all_num_agents},
        "wheel": {n: nx.wheel_graph(n) for n in all_num_agents},
        "complete": {n: nx.complete_graph(n) for n in all_num_agents},
        "cycle": {n: nx.cycle_graph(n) for n in all_num_agents},
    }

    epsilons = [0.1, 0.01, 0.001]#, 0.01, 0.001]

    num_simulations = 10000

    m = None
    known_mean = 0.5
    max_num_experiments = 1200

    for num_agents in tqdm(all_num_agents):
        for epsilon in epsilons:
            for graph_type in graphs.keys():
                true_act = SimpleAction(known_mean + epsilon)
                acts = [true_act, SimpleAction(known_mean - epsilon)]
                m = None

                G = graphs[graph_type][num_agents]
                output = pool.starmap(run_simulation,
                                      [(G, m, acts, true_act, known_mean, max_num_experiments)]* num_simulations)

                successful_convergence = 0
                unsuccessful_convergence = 0
                for o in output:
                    all_data["num_agents"].append(num_agents)
                    all_data["graph"].append(graph_type)
                    all_data["difficulty"].append(epsilon)
                    all_data["successful_convergence"].append(o["successful_convergence"])
                    all_data["unsuccessful_convergence"].append(o["unsuccessful_convergence"])
                    all_data["time_to_convergence"].append(o["time_to_convergence"])
                    successful_convergence += o["successful_convergence"]
                    unsuccessful_convergence += o["unsuccessful_convergence"]
                all_prob_data["num_agents"].append(num_agents)
                all_prob_data["graph"].append(graph_type)
                all_prob_data["difficulty"].append(epsilon)
                all_prob_data["prob_successful_convergence"].append(float(successful_convergence) / float(num_simulations))
                all_prob_data["prob_unsuccessful_convergence"].append(float(unsuccessful_convergence) / float(num_simulations))
                all_prob_data["avg_time_to_convergence"].append(np.average(all_data["time_to_convergence"]))
        df_all_prob = pd.DataFrame(all_prob_data)
        df_all = pd.DataFrame(all_data)
        df_all.to_csv("all_data.csv",index=False)
        df_all_prob.to_csv("all_prob_data.csv",index=False)
df_all_prob = pd.read_csv(open("from_aws/all_prob_data.csv", "rb"))
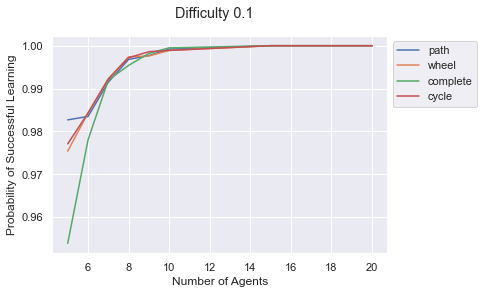
difficulty = 0.1

ax= sns.lineplot(x="num_agents",
                 y="prob_successful_convergence",
                 hue='graph',
                 data = df_all_prob[df_all_prob['difficulty'] == difficulty])
ax.set_ylabel("Probability of Successful Learning")
ax.set_xlabel("Number of Agents")
plt.legend(bbox_to_anchor=(1,1))
plt.suptitle(f"Difficulty {difficulty}")
plt.show();
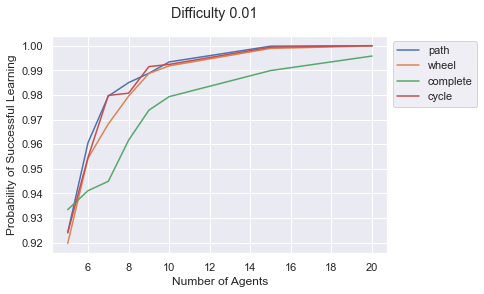
difficulty = 0.01

ax= sns.lineplot(x="num_agents",
                 y="prob_successful_convergence",
                 hue='graph',
                 data = df_all_prob[df_all_prob['difficulty'] == difficulty])
ax.set_ylabel("Probability of Successful Learning")
ax.set_xlabel("Number of Agents")
plt.legend(bbox_to_anchor=(1,1))
plt.suptitle(f"Difficulty {difficulty}")
plt.show();
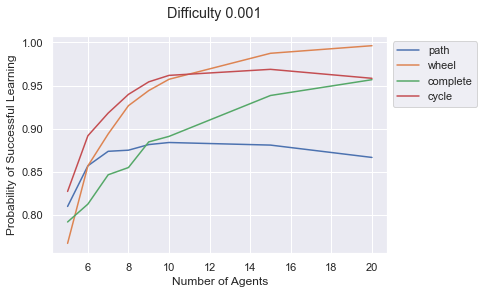
difficulty = 0.001

ax= sns.lineplot(x="num_agents",
                 y="prob_successful_convergence",
                 hue='graph',
                 data = df_all_prob[df_all_prob['difficulty'] == difficulty])
ax.set_ylabel("Probability of Successful Learning")
ax.set_xlabel("Number of Agents")
plt.legend(bbox_to_anchor=(1,1))
plt.suptitle(f"Difficulty {difficulty}")
plt.show();
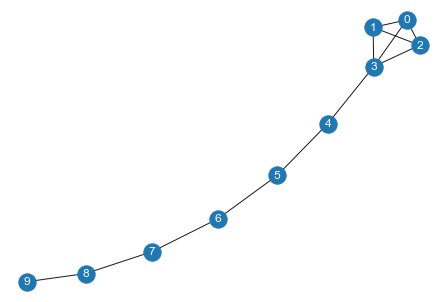
The next experiment considers a number of different graphs on 10 agents. The graphs all have a path that leads to a complete graph. For instance, “complete-6” consists of a path of 6 nodes that leads to a complete graph of 4 nodes:
G = nx.lollipop_graph(4, 6)

nx.draw(G, with_labels=True, font_color='white')
plt.show();
SKIP_SIMULATION = True # skip running this by default, since it takes a very long time to run

if not SKIP_SIMULATION:
    print(f'CPUS: {cpu_count()}')
    cpus = cpu_count()
    pool = Pool(12)

    all_prob_data = {
        "num_agents": list(),
        "graph": list(),
        "difficulty": list(),
        "prob_successful_convergence": list(),
        "prob_unsuccessful_convergence": list(),
        "avg_time_to_convergence": list(),
    }

    all_data = {
        "num_agents": list(),
        "graph": list(),
        "difficulty": list(),
        "successful_convergence": list(),
        "unsuccessful_convergence": list(),
        "time_to_convergence": list(),
    }


    graphs = {
        "complete": nx.lollipop_graph(10,0),
        "complete-1": nx.lollipop_graph(9,1),
        "complete-2": nx.lollipop_graph(8,2),
        "complete-3": nx.lollipop_graph(7,3),
        "complete-4": nx.lollipop_graph(6,4),
        "complete-5": nx.lollipop_graph(5,5),
        "complete-6": nx.lollipop_graph(4,6),
        "complete-7": nx.lollipop_graph(3,7),
        "path": nx.lollipop_graph(2,8),
    }


    m = None
    known_mean = 0.5
    max_num_experiments = 1500

    num_simulations = 10#000

    num_agents = 10
    epsilon = 0.001

    true_act = SimpleAction(known_mean + epsilon)
    acts = [true_act, SimpleAction(known_mean - epsilon)]

    for graph_type in tqdm(graphs.keys()):

        G = graphs[graph_type]
        output = pool.starmap(run_simulation,
                              [(G, m, acts, true_act, known_mean, max_num_experiments)]* num_simulations)

        successful_convergence = 0
        unsuccessful_convergence = 0
        for o in output:
            all_data["num_agents"].append(num_agents)
            all_data["graph"].append(graph_type)
            all_data["difficulty"].append(epsilon)
            all_data["successful_convergence"].append(o["successful_convergence"])
            all_data["unsuccessful_convergence"].append(o["unsuccessful_convergence"])
            all_data["time_to_convergence"].append(o["time_to_convergence"])
            successful_convergence += o["successful_convergence"]
            unsuccessful_convergence += o["unsuccessful_convergence"]
        all_prob_data["num_agents"].append(num_agents)
        all_prob_data["graph"].append(graph_type)
        all_prob_data["difficulty"].append(epsilon)
        all_prob_data["prob_successful_convergence"].append(float(successful_convergence) / float(num_simulations))
        all_prob_data["prob_unsuccessful_convergence"].append(float(unsuccessful_convergence) / float(num_simulations))
        all_prob_data["avg_time_to_convergence"].append(np.average(all_data["time_to_convergence"]))

    df_all_prob = pd.DataFrame(all_prob_data)
    df_all = pd.DataFrame(all_data)
    df_all.to_csv("diff_graphs_all_data.csv",index=False)
    df_all_prob.to_csv("diff_graphs_all_prob_data.csv",index=False)
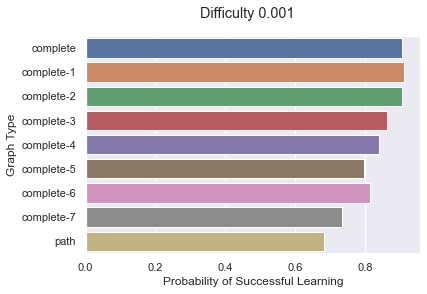
diff_graphs_df_all_prob = pd.read_csv(open("from_aws/diff_graphs_all_prob_data.csv", "rb"))
difficulty = 0.001

ax = sns.barplot(y="graph",
                 x="prob_successful_convergence",
                 data = diff_graphs_df_all_prob[diff_graphs_df_all_prob['difficulty'] == difficulty],
               orient='h')
ax.set_ylabel("Graph Type")
ax.set_xlabel("Probability of Successful Learning")
plt.suptitle(f"Difficulty {difficulty}")
plt.show();
Further Reading
K. Zollman, (2013). Network epistemology: Communication in epistemic communities, Philosophy Compass, 8 (1), pp. 15 - 27.
K. Zollman, (2010). The Epistemic Benefit of Transient Diversity, Erkenntnis, 72, pp. 17 - 35.
K. Zollman (2011). Social Network Structure and the Achievement of Consensus, Politics, Philosophy, and Economics 11, pp. 26 - 44.
S. Rosenstock, J. Bruner, and C. O’Connor (2017). In Epistemic Networks, Is Less Really More?, Philosophy of Science.
J. Thoma (2015). The Epistemic Division of Labor Revisited, Philosophy of Science, 82(3)